Day 2 Atmospheric Summer Experience Langley
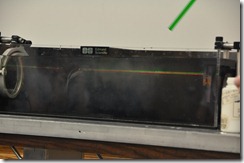
The day began a bit early, well not too early. We began the day getting a demonstration about lasers. Dr. Sam Chen who works with lasers explained to us that they are working on using lasers to measure different weather parameters. Currently the CALIPSO satellite uses lasers to detect aerosols and clouds. A future project is called ASCENDS, Dr. Chen is currently working on this. His demonstration was an excellent physics teaching tool and light tool. He first showed us two lasers red and green shinning through a tank of water. He then dropped a scattering liquid in the tank. The results were pretty fun to watch. Dr. Sam Chen explained this is the way they are using lasers to investigate pollutants, ozone, water vapor and other particles in the atmosphere.
After the laser demonstration we headed back to the classroom for our introduction to My NASA Data. Preston Lewis did a wonderful job explaining the website and what type of data teachers could use in the classroom. One thing he pointed out was the ability to compare different days and measurements. He showed us examples of lessons that appear on the website,one of them was a tree rings activity. Preston used the rings of the tree and compared that data with precipitation data. The lesson plans were excellent and something I could use in the classroom. It was nice to find new ways to implement the data from this site. Great resource and thanks for showing us.
S’COOL and Rover were the next websites and tools we went over. We started off by taking cloud observations for the satellite overpass. The observations included height level, type, opacity and cloud coverage. Susan Crecelius, took us through the proper way of observing clouds and making an observation on the S’COOL website. I’ve used this website and last year had my students do observations with their weather forecasting unit. But I did not know about the other resources available on the site. There are links and resources for teachers that are really helpful with taking observations. One of the important parts of the observation are the height levels of clouds, Susan went over the proper way of taking observations. Once she finished she then showed us how to export our observations into an excel sheet and create a graph. There are tutorials on the website for teachers to use to help them with the data.
The day was excellent and again tons of resources were given for the classroom. Day 3 will bring a weather balloon launch and information on CLAIPSO.
Posted on July 25, 2012, in Uncategorized. Bookmark the permalink. Leave a comment.


Leave a comment
Comments 0